(more see downloads)
CAHR - A Human Reliability Assessment approach
CAHR means "Connectionism Assessment of
Human Reliability". The Database-System CAHR is a tool for analyzing operational
disturbances, which are caused by inadequate Human actions or organizational
factors. It was implemented using MICROSOFT ACCESS. CAHR contains a generic
knowledge base for the event analysis that is extendable by the description
of further events. The knowledge-base contains information about the system-state
and the tasks as well as for error opportunities and influencing factors
(PSFs).
The method applies a new way in the analysis and assessment of the human role in technical systems. It's philosophy is:
Areas where CAHR was applied inculde
The model allows to find causes and improvements for human errors in a single event as well as an assessment of error possibilities and measures in future settings.
In contrast to past methods for event analysis,
the process developed in this study is an analytical and not a classifying
method. In the method, an event is systematically broken down, analyzed,
and described for the purpose of a qualitative error and cause determination.
The analysis method proceeds from general questions to substantive information
that was observable during the event, and, via actions it moves on to error
indications and performance-shaping factors. This object oriented procedure
facilitates the analysis especially when initially only little information
is available about the event. Although the method developed here also employs
known taxonomies from literature for support during analysis, it is not
tied to any fixed, predetermined descriptors; it is, in other words, an
open procedure. In that way, the approach makes it possible to preserve
also the original information of the events and makes the analysis of an
event replicable in general. Besides, there is no compulsion to categorize
an event in a certain classification scheme that might possibly not reproduce
actually observed aspects correctly and that could thus lead to misinterpretations.
Figure 1-1 Structure of the System
Structure of the system
CAHR concsists of the following Modules:
- "Event Analysis"
- "Qualitative und quantitative Assessment"
Event Input
Here we put in all relevant
information on the event regarding general characteristics of the plant
and of the system state (Figure 1-2). By simply clicking on the arrows,
one can quickly enter all necessary characteristics of the procedure. The
contents of characteristic input can also be expanded.
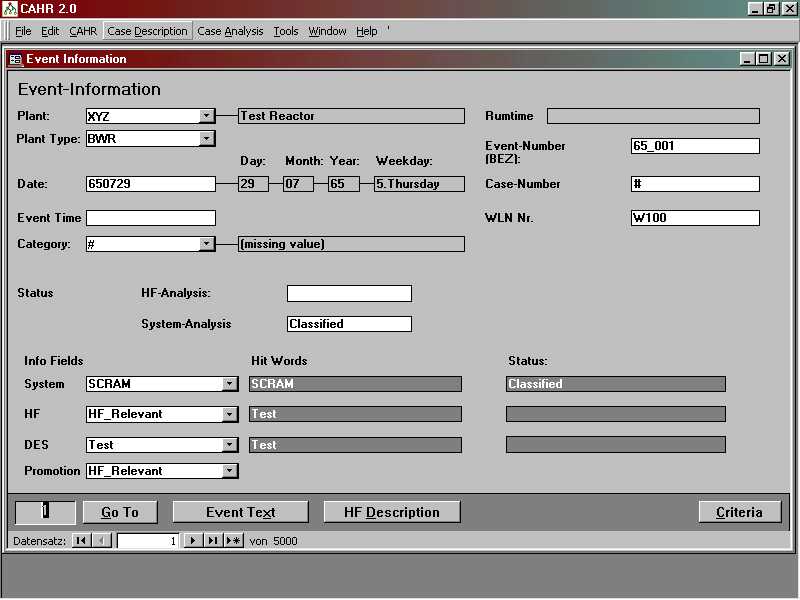
Figure 1-2 Put in Characteristics into the Databank
Input of Event Descriptions
The event descriptions
are filed in a text field and a commentary field (Figure 1-3). The fields
can be searched for certain concepts by means of full text search.
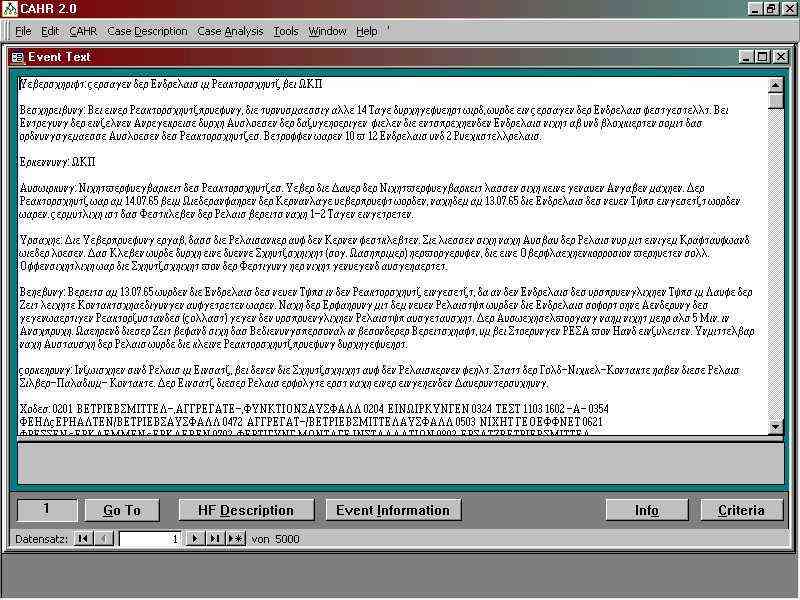
Figure 1-3 Event Description in Databank
Input of Relevant Event Information
All relevant information
concerning human actions is put in interactively. Figure 1-4 by way of
example shows the input into the databank for the sub-taxonomy object-person.
In event analysis, one builds up the input of general questions on information
items that were observable during the event (object, action) into error
data and performance-shaping factors. This is done in an implicative way,
that is to say, for example, one may enter only one error in the "indication"
column if an object and an action have already been stated. The same applies
to the performance-shaping factors in the column "property." In that way
one can make sure that the effectiveness relationship between actions,
errors, and performance-shaping factors will be illustrated so that it
is determined what the performance-shaping factor acted on.
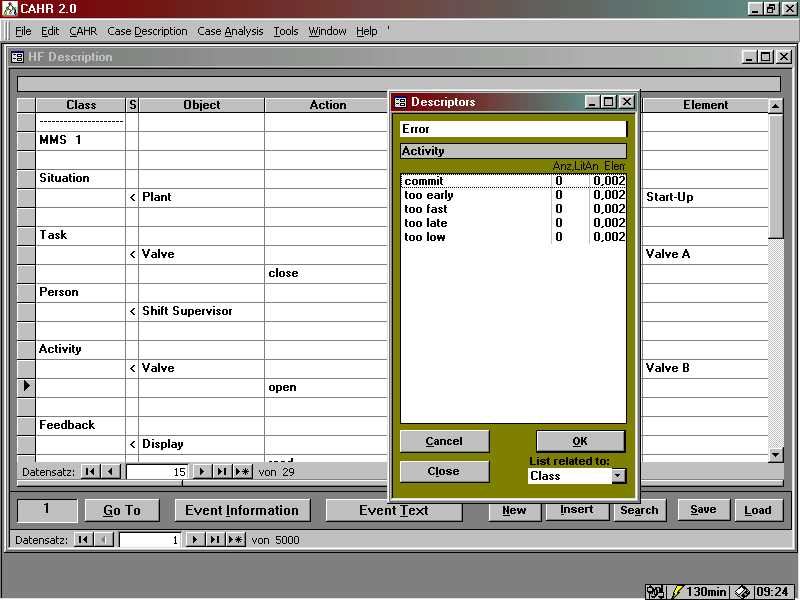
Figure 1-4 Input of Human Factor Information Into Databank
This object oriented procedure
facilitates the analysis of events because one starts with information
that was observable on the technical system. In addition, it avoids allocation
of culpability because the event is analyzed by starting with the error
situation and not by starting with the persons who are involved. By offering
decision making aids during concept selection to the person who wants to
describe an event with the help of this procedure, the concepts are sorted
according to frequency of use.
Qualitative und quantitative Assessment
Analysis of Events
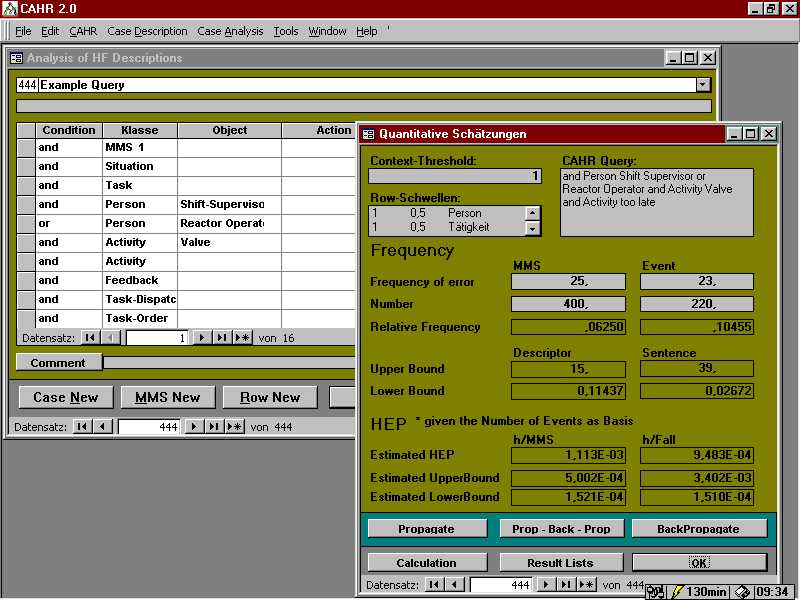
Figure 1-5 Illustration of a Quantitative Inquiry in the Databank System
For each interrelationship, that was observed with a frequency of more than 0, one can determine qualitative interrelationships on the basis of all cases of available information observed so far. A typical inquiry to the collective data is for instance: "How many errors of confusion were observed, what performance-shaping factors were observed, and what precautions were initiated against repetition?" Figure 1-6 and Figure 1-7 show this inquiry within the databank. It is answered by the databank system with the help of various lists; information items gained can be traced back all the way to the individual cases.
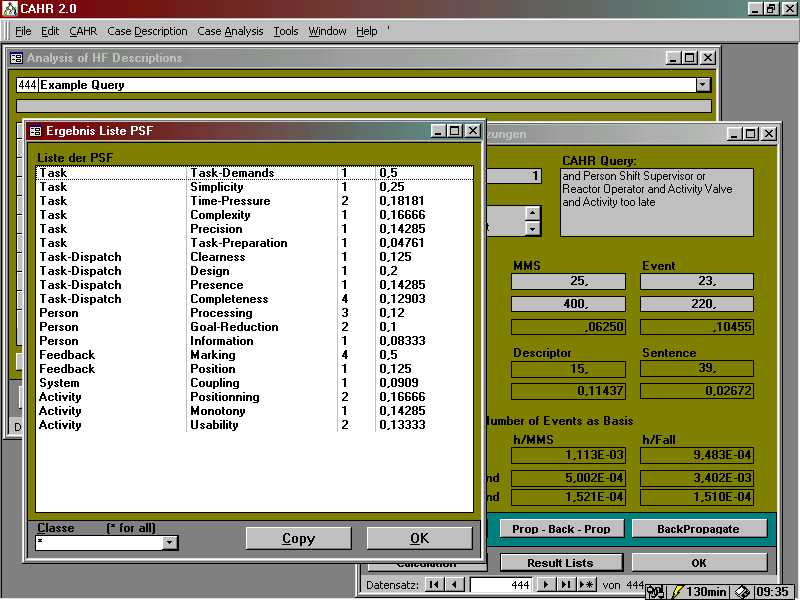
Figure 1-6 Illustration of a Qualitative Inquiry in the Databank System
Class Editor
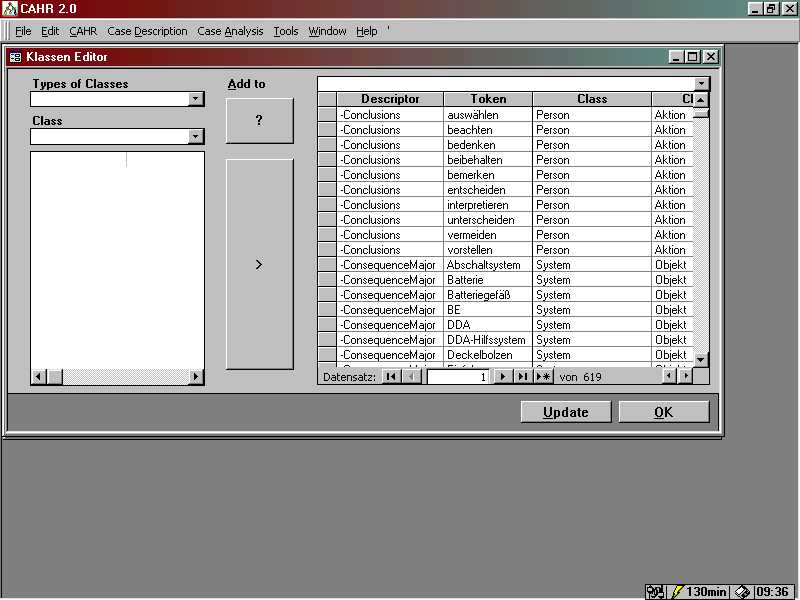
Figure 1-7 Illustration of Class Formation
Tables for Diagram Preparation
Data can be processed in another way by inquiries and cross reference tables to illustrate simple interrelationships or reciprocal relations in the form or tables or diagrams. Inquiries are styled interactively and are stored. The data can be processed graphically in various ways. All possibility from the customary WINDOWS PRODUCTS are available to vary the graphic processing (for example, copy the graphs and tables in Text Processing or Table calculations).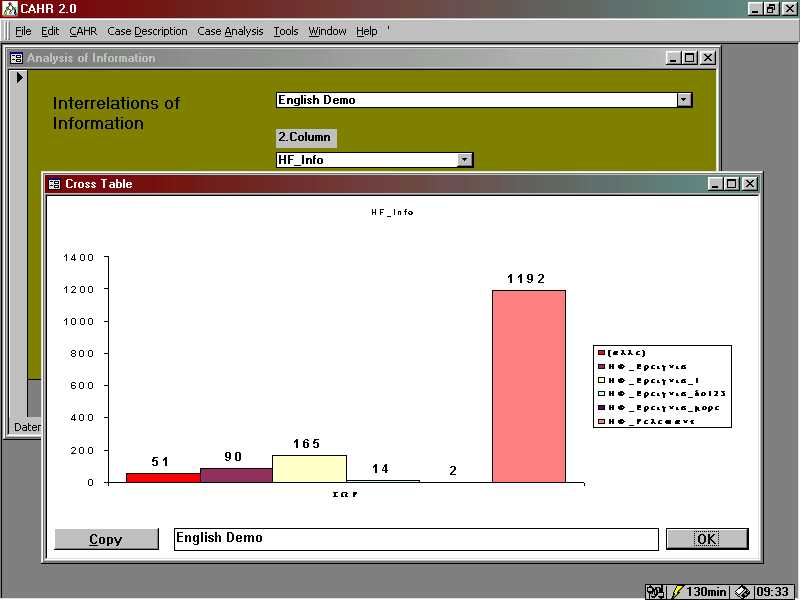
Figure 1-8 Analysis of Characteristics in the Databank System